General Principles
The data analysis kit is continuously integrated set of tools which provide versatile and deployable
- Data explorer and subsetting We foresee to develop 3 distinct end-user facing apps.
- Diverse visualization and analysis dashboards, which can be also run interactively as standard
jupyternotebooks. - Other example analysis pipelines which integrate additional tools and datasets, such as those in MGnify


The interactive jupyter content is available in marine-omics-demos (momics-demos) repository. Methods supporting these dashboards are compiled in an additional marine-omics-methods (momics) repository.
Dashboards are implemented in panel by Holoviz. The momics-demos repository can be deplyoed to any jupyter server. To promote ease of first contact, NBs are designed to run locally after cloning the repository, run on mybinder.org or in google colab environment.
Notebooks can be run as is, and panel widgets combined with your own code, or alternatively design your own workflow ignoring the widgets and using only the momics-methods. To serve the dashboard from the NB, click the panel icon
Run locally or on JupyterHub server
# setup venv (conda example)
conda create -n momics-demos python

# clone repository
git clone https://github.com/emo-bon/momics-demos

# install dependencies (using poetry here)
pip install -e .[dependencies]

# setup jupyterlab kernel
python -m ipykernel install --user --name momics-demos

# run local server (not applicable for server deployment)
python -m jupyterlab
Run on binder
Follow one of the links to the NBs in the README file or . Note that out of experience, Google Colab runs faster, however you need a ngrok account (see IMPORTANT NOTE).
Run on Google colab
Follow one of the links to the NBs in the README file or open the whole repository by pasting https://github.com/emo-bon/momics-demos into a GitHub field on colab.research.
IMPORTANT NOTE
At the moment, NBs/dashboards loaded over Google Colab run FASTER than the binder equivalents. However, in order to display a dashboard or even separate dashboard components (widgets), you will need ngrok account, which basically:
- after registering, you will need to put your token in the
.envfile, which you upload to the root of you GColab sessionNGROK_TOKEN="..........."- alternatively you manually define it directly in a new cell
os.environ["NGROK_TOKEN"] = "my_secret_token"
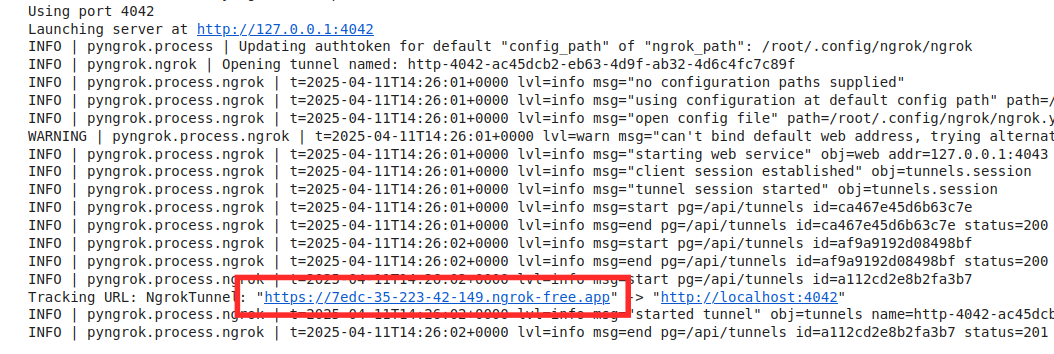
- In practice, ngrok creates a tunnel to a separate url with the dashboard
- will show you a link as below, which contains the dashboard
Design principles
- Minimize dependencies (already failing) to facilitate wide adaptation and further development of the codebase.
- Simplicity over speed, however performance is considered.
- (Not implemented yet) Data import/export options after UDAL queries made easy. (backend data queries developed by VLIZ)
- Combining strengths of python/R/julia packages developed in those languages.
- API calls to other services, such as Galaxy.