Tools and Platforms Utilized
A combination of visualization web platforms, data access services, and custom scripts was employed to process and analyze the selected datasets:
webODV[2]
https://
- GEOTRACES data
- Helium isotope data
- Copernicus Marine Service – GlobColour products (Chlorophyll-a, BBP)
- Sea surface height and geostrophic current datasets
- BGC-Argo float profiles
VolcPlume[4]
https://
EuroArgo Tools
- Data Selection Portal
- Fleet Monitoring Interface
These tools were used to collocate Argo float trajectories in time and space with volcanic activity from Hunga Tonga and Etna.
Custom Python Code
A dedicated script was developed during the Hackathon to read and visualize MODIS-Aqua Level-2 nFLH (Normalized Fluorescence Line Height) data, which has an unconventional NetCDF structure (not gridded, under-track format, using NetCDF grouping function).
GitHub repository: modis.py
MyOcean Pro
Used for rapid pre-visualization of Chlorophyll-a and BBP time series derived from Copernicus Marine Service products in the study region.
Some of these visualization platforms, data access services, and custom scripts have been deployed on the FAIR-EASE testbed. Figure 0 shows the overall test bed, which encompasses several infrastructures.
In order to work on the interoperability between the data, a set of services have been deployed on a single infrastructure, namely the UCA testbed. This enabled testing of cloud format files and easy access to several analytical services.
Note: Figure 0 contains only the infrastructure where new services have been deployed, not the ones (such as VolcPlume, existing webODV instances…) that already existed.
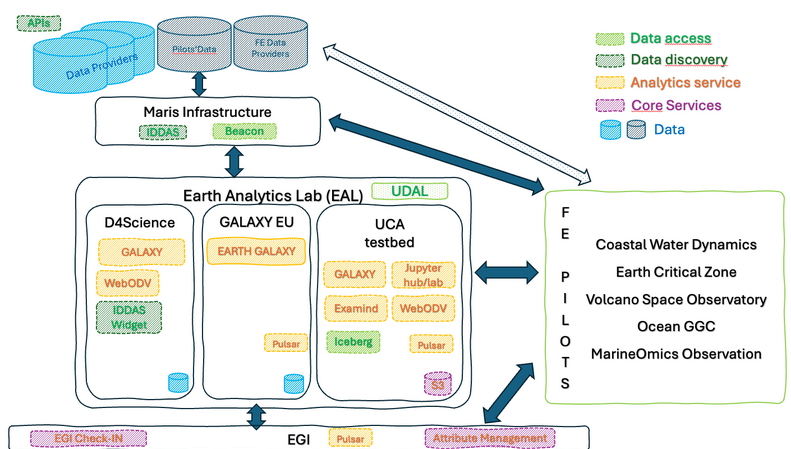 Figure 0: FAIR-EASE infrastructure testbed
webODV is an online data exploration and visualization platform developed as a web-based extension of the widely used Ocean Data View (ODV) software. It enables users to interactively explore, subset, and visualize large oceanographic and environmental datasets without requiring local software installation.
The testbed is a datalake infrastructure at UCA mesocentre
VolcPlume is a web-based visualization and analysis platform developed by Univ. Lille/LOA and AERIS/ICARE to monitor and study volcanic gas/particle emissions using satellite and ground data. It integrates a wide range of remote sensing products to track the emission and dispersion of volcanic plumes in the atmosphere (in near-real time or retrospectively).