webODV is the online version of the popular Ocean Data View (ODV) desktop software for analysis and visualization of marine and other environmental data. ODV has over 130,000 registered users, and, based on recent software download counts, is actively used by more than 13,000 researchers worldwide. Like ODV, webODV provides an interactive graphical user interface and offers rich feature sets via context specific menus. While desktop ODV requires all datasets to reside on the end user machine, webODV works differently. All datasets as well as a special version of the ODV software reside and run on dedicated webODV servers. Users do not have to install any software or download the sometimes-bulky datasets. Instead, users simply connect to datasets using their web-browser. New browser tabs open for every opened dataset, each tab providing an “ODV-like” interactive user interface. Previous ODV users will find it very easy to work with webODV. Concise getting-started documents help guide new users.
Large volumes of important environmental datasets for all parts of the
Earth System are accessible from webODV servers summarized at
[https://
The figure below shows a typical situation on the user’s computer, where several multi-disciplinary datasets residing on different webODV servers are open in different browser panes. In addition, the user has several local data collections open in separate instances of the ODV desktop software running locally. Publication-ready figures can easily be created from any of the open datasets.
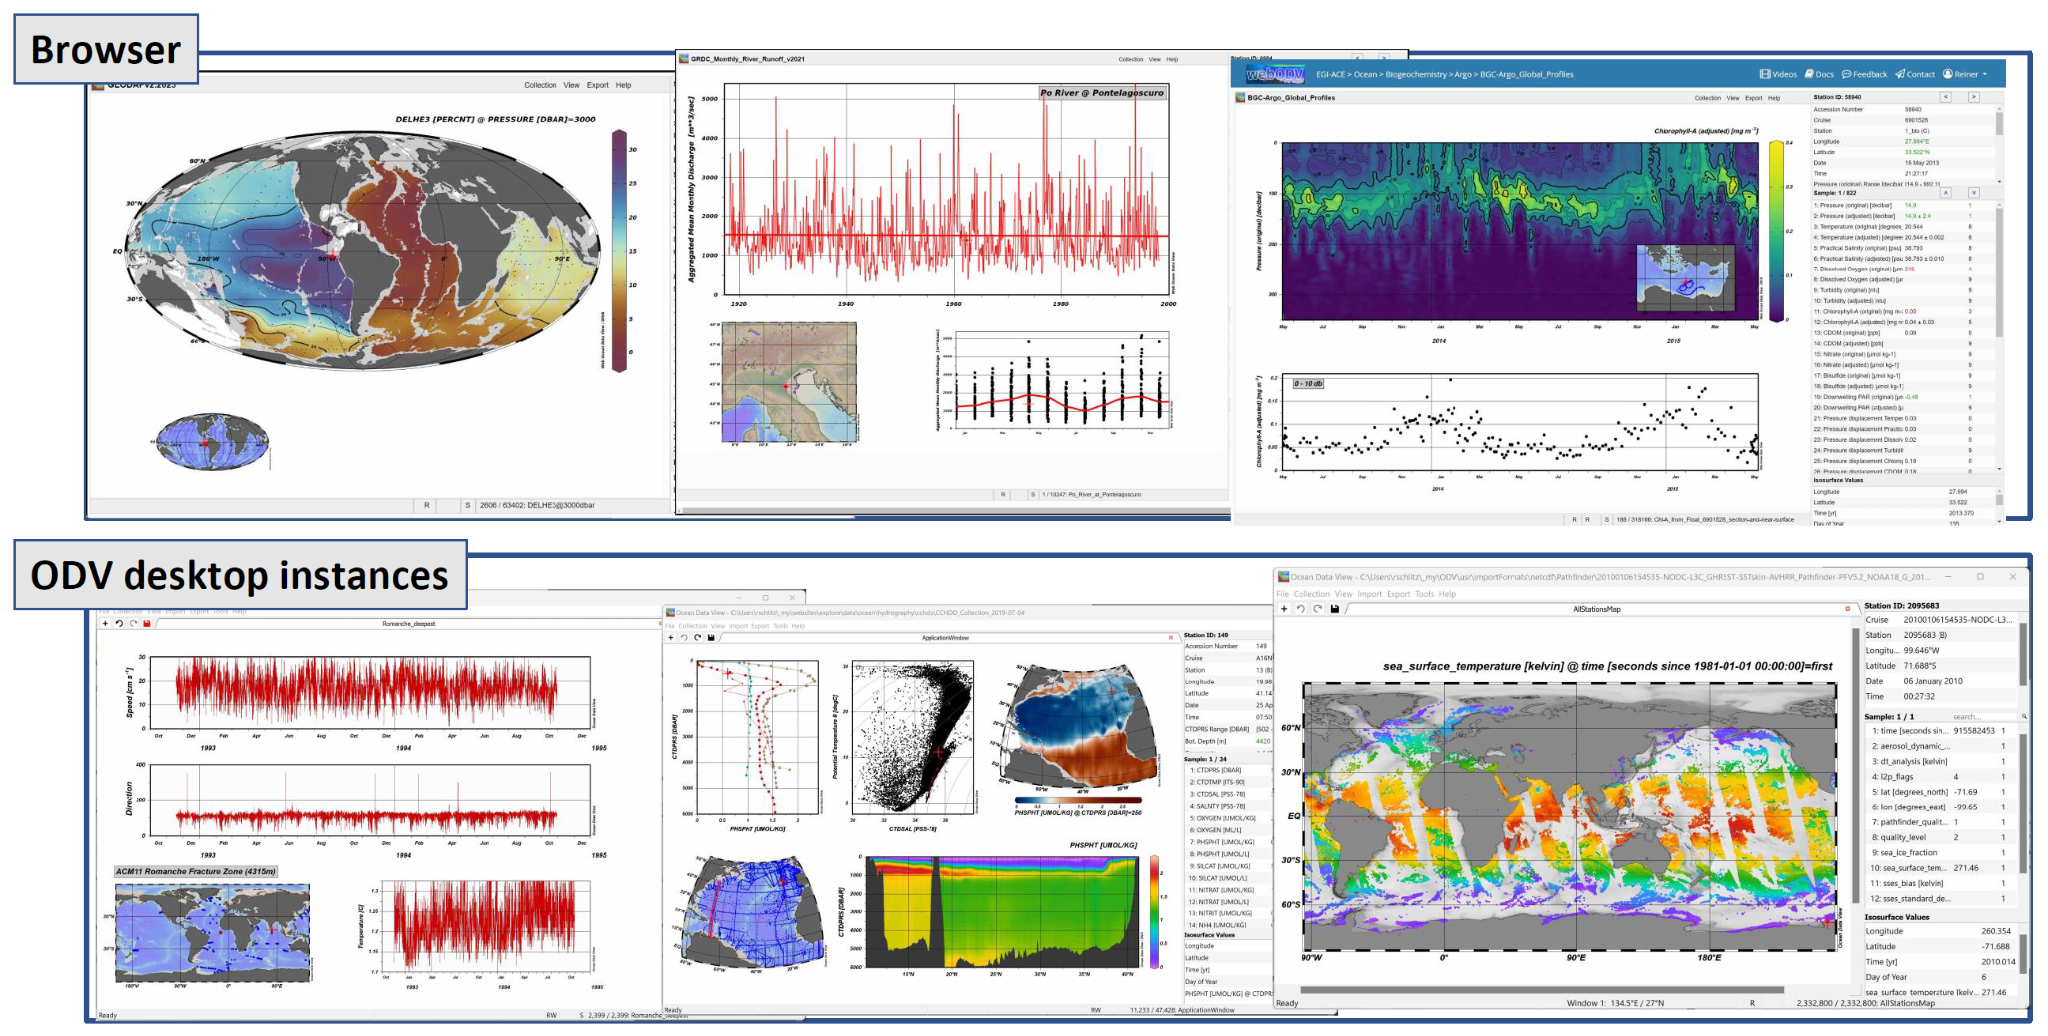
Figure 1:Screenshot of a data analysis session with several multi-disciplinary datasets open in webODV and ODV desktop
As a new feature developed during the FAIR-EASE project, users can now link the open multi-disciplinary datasets by exchanging graphics elements as well as actual data between any two data windows in webODV or ODV desktop.
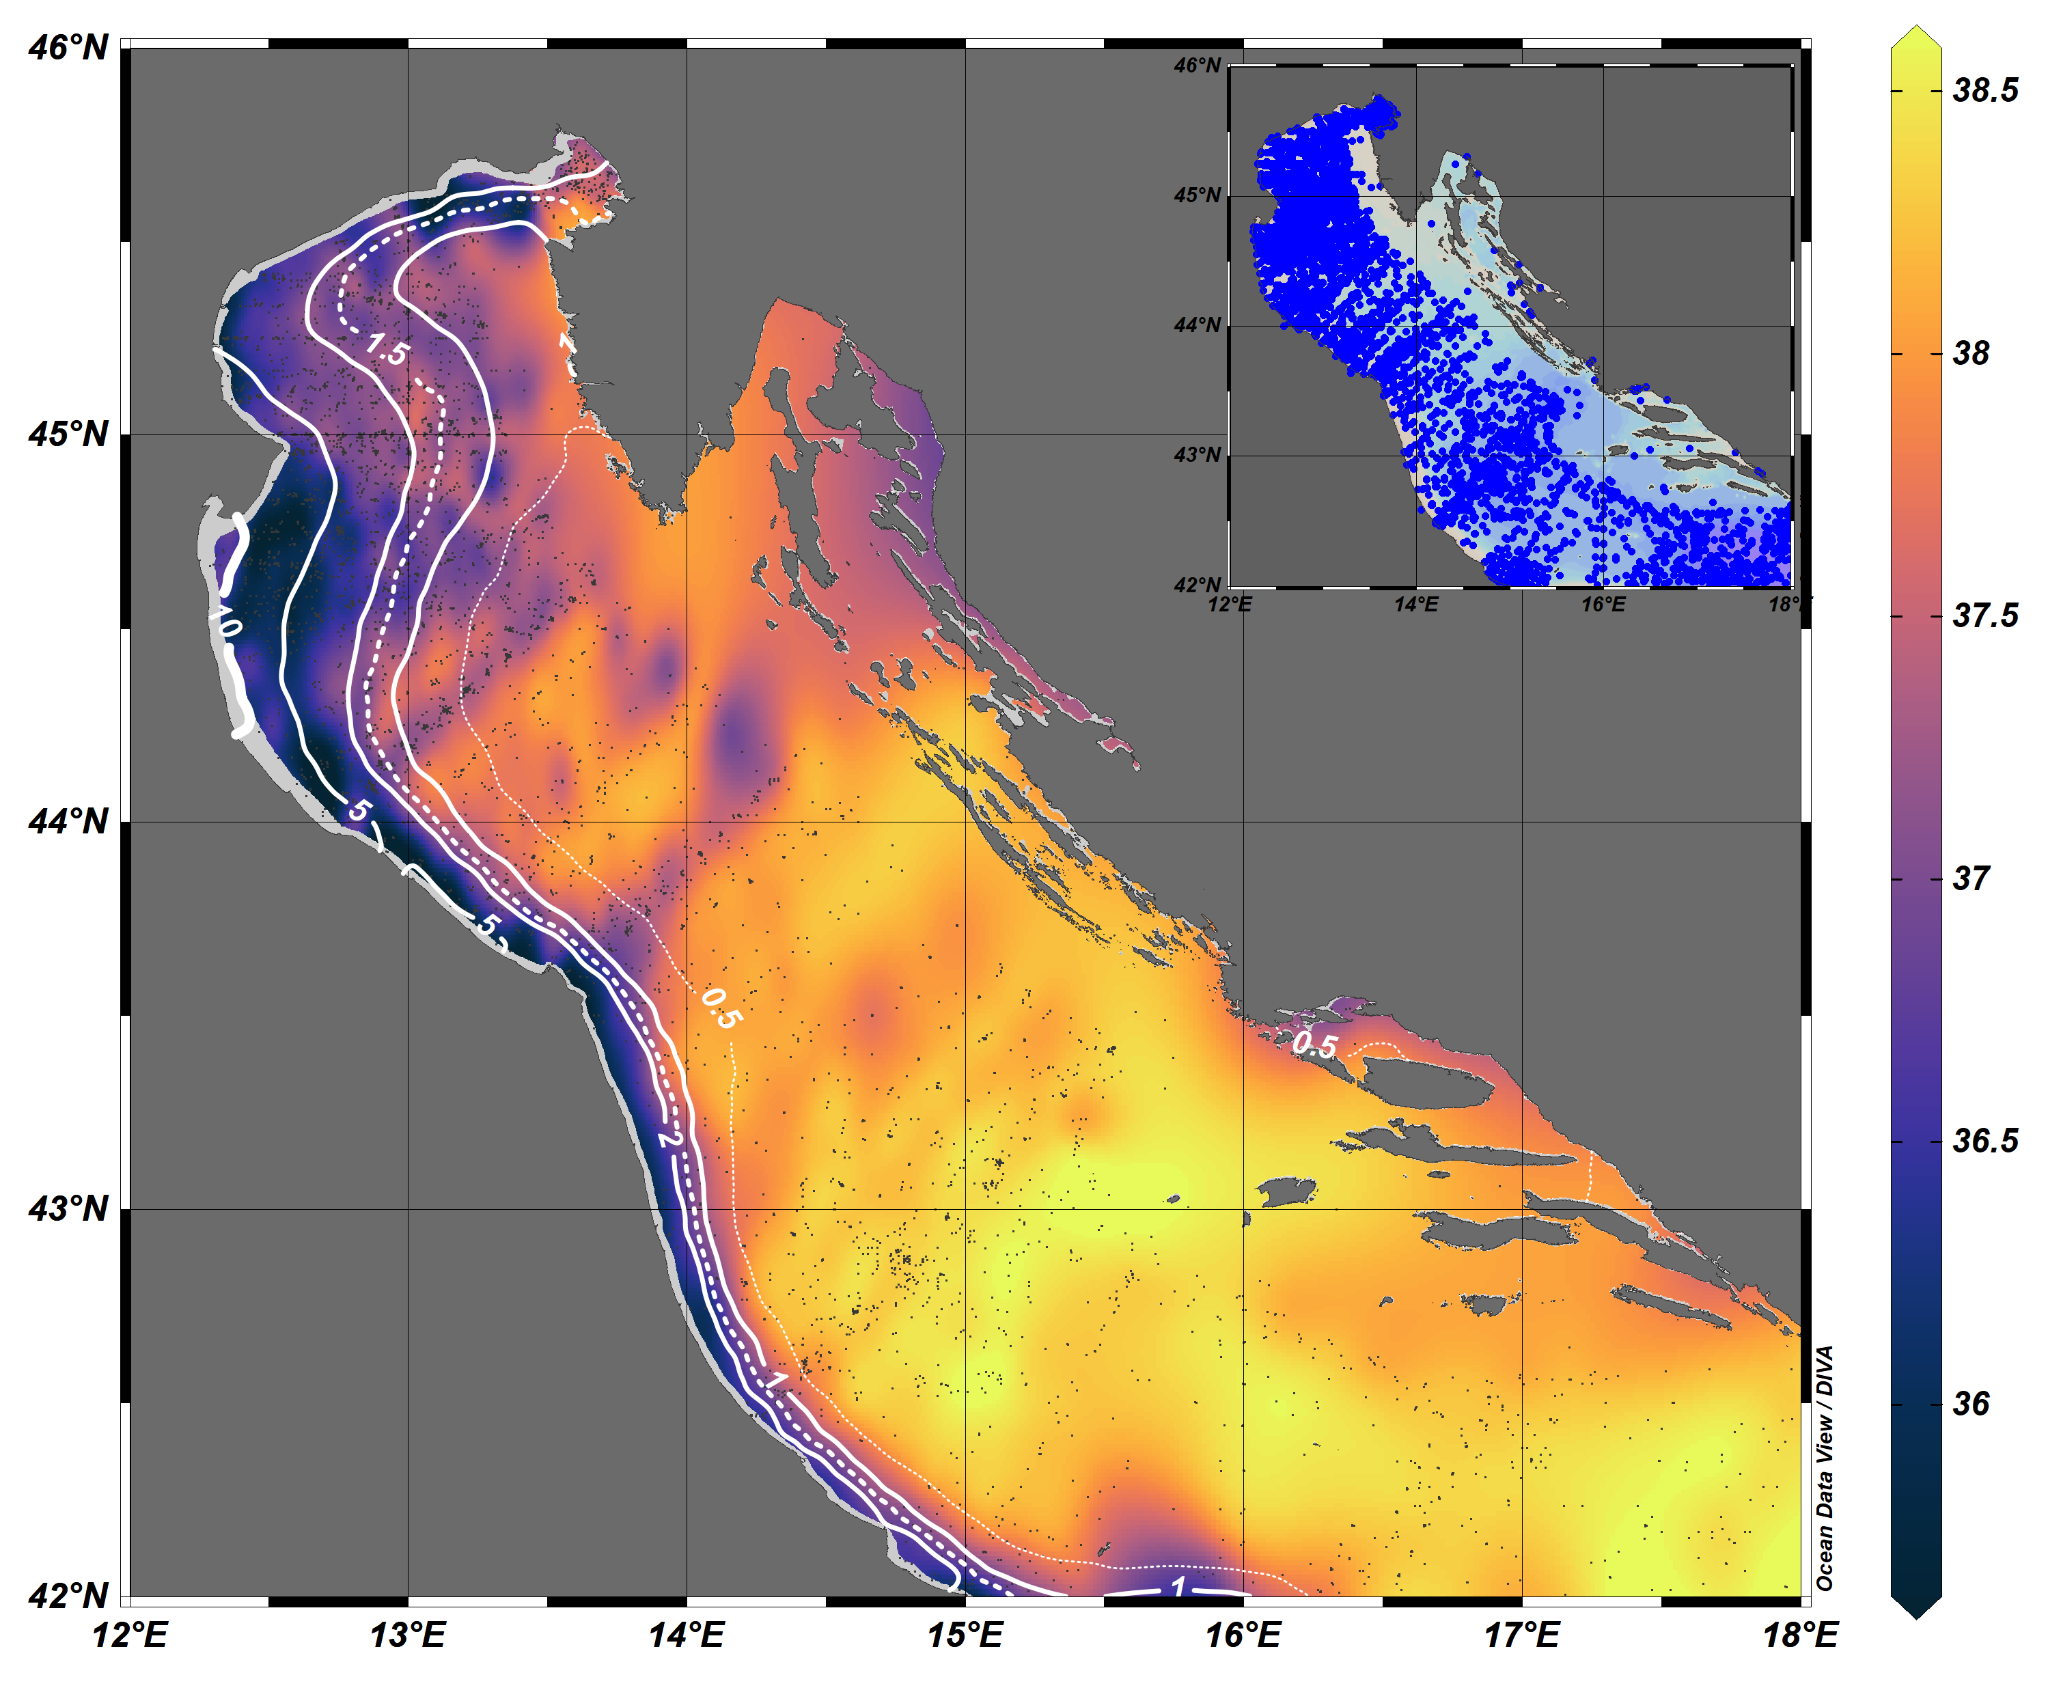
Figure 2:Contours of surfacewater Chorophyll-a concentrations determined by satellite sensors overlain on color-shaded salinity at 10 m depth
This is an example of exchanging graphics elements between datasets. Here surface water Chorophyll-a concentrations determined by satellite sensors are overlain on color-shaded salinity at 10 m depth. It is clearly visible that high chlorophyll values in the northwestern Adriatic and along the Italian coast coincide with low salinity caused by runoff and transport of Po river water. This shows the importance of river discharge for the biological productivity and eventually fish stock size.
Exchange of actual data between windows allows the computation of new quantities, such as difference or ratio. This can be applied to detect spatial and temporal changes, for instance between reoccupations of oceanographic sections. This will benefit research in our changing environment.