Last update 👈
David Palecek, May 5, 2025
Diversity dashboards currently summarize first 181 EMO-BON sampling events. They are split into two separate dashboards because of memory limits of the free (Binder or Colab) environments, but in principle they provide complementary functionality.
Jupyter Notebooks for the dashboards can be found here
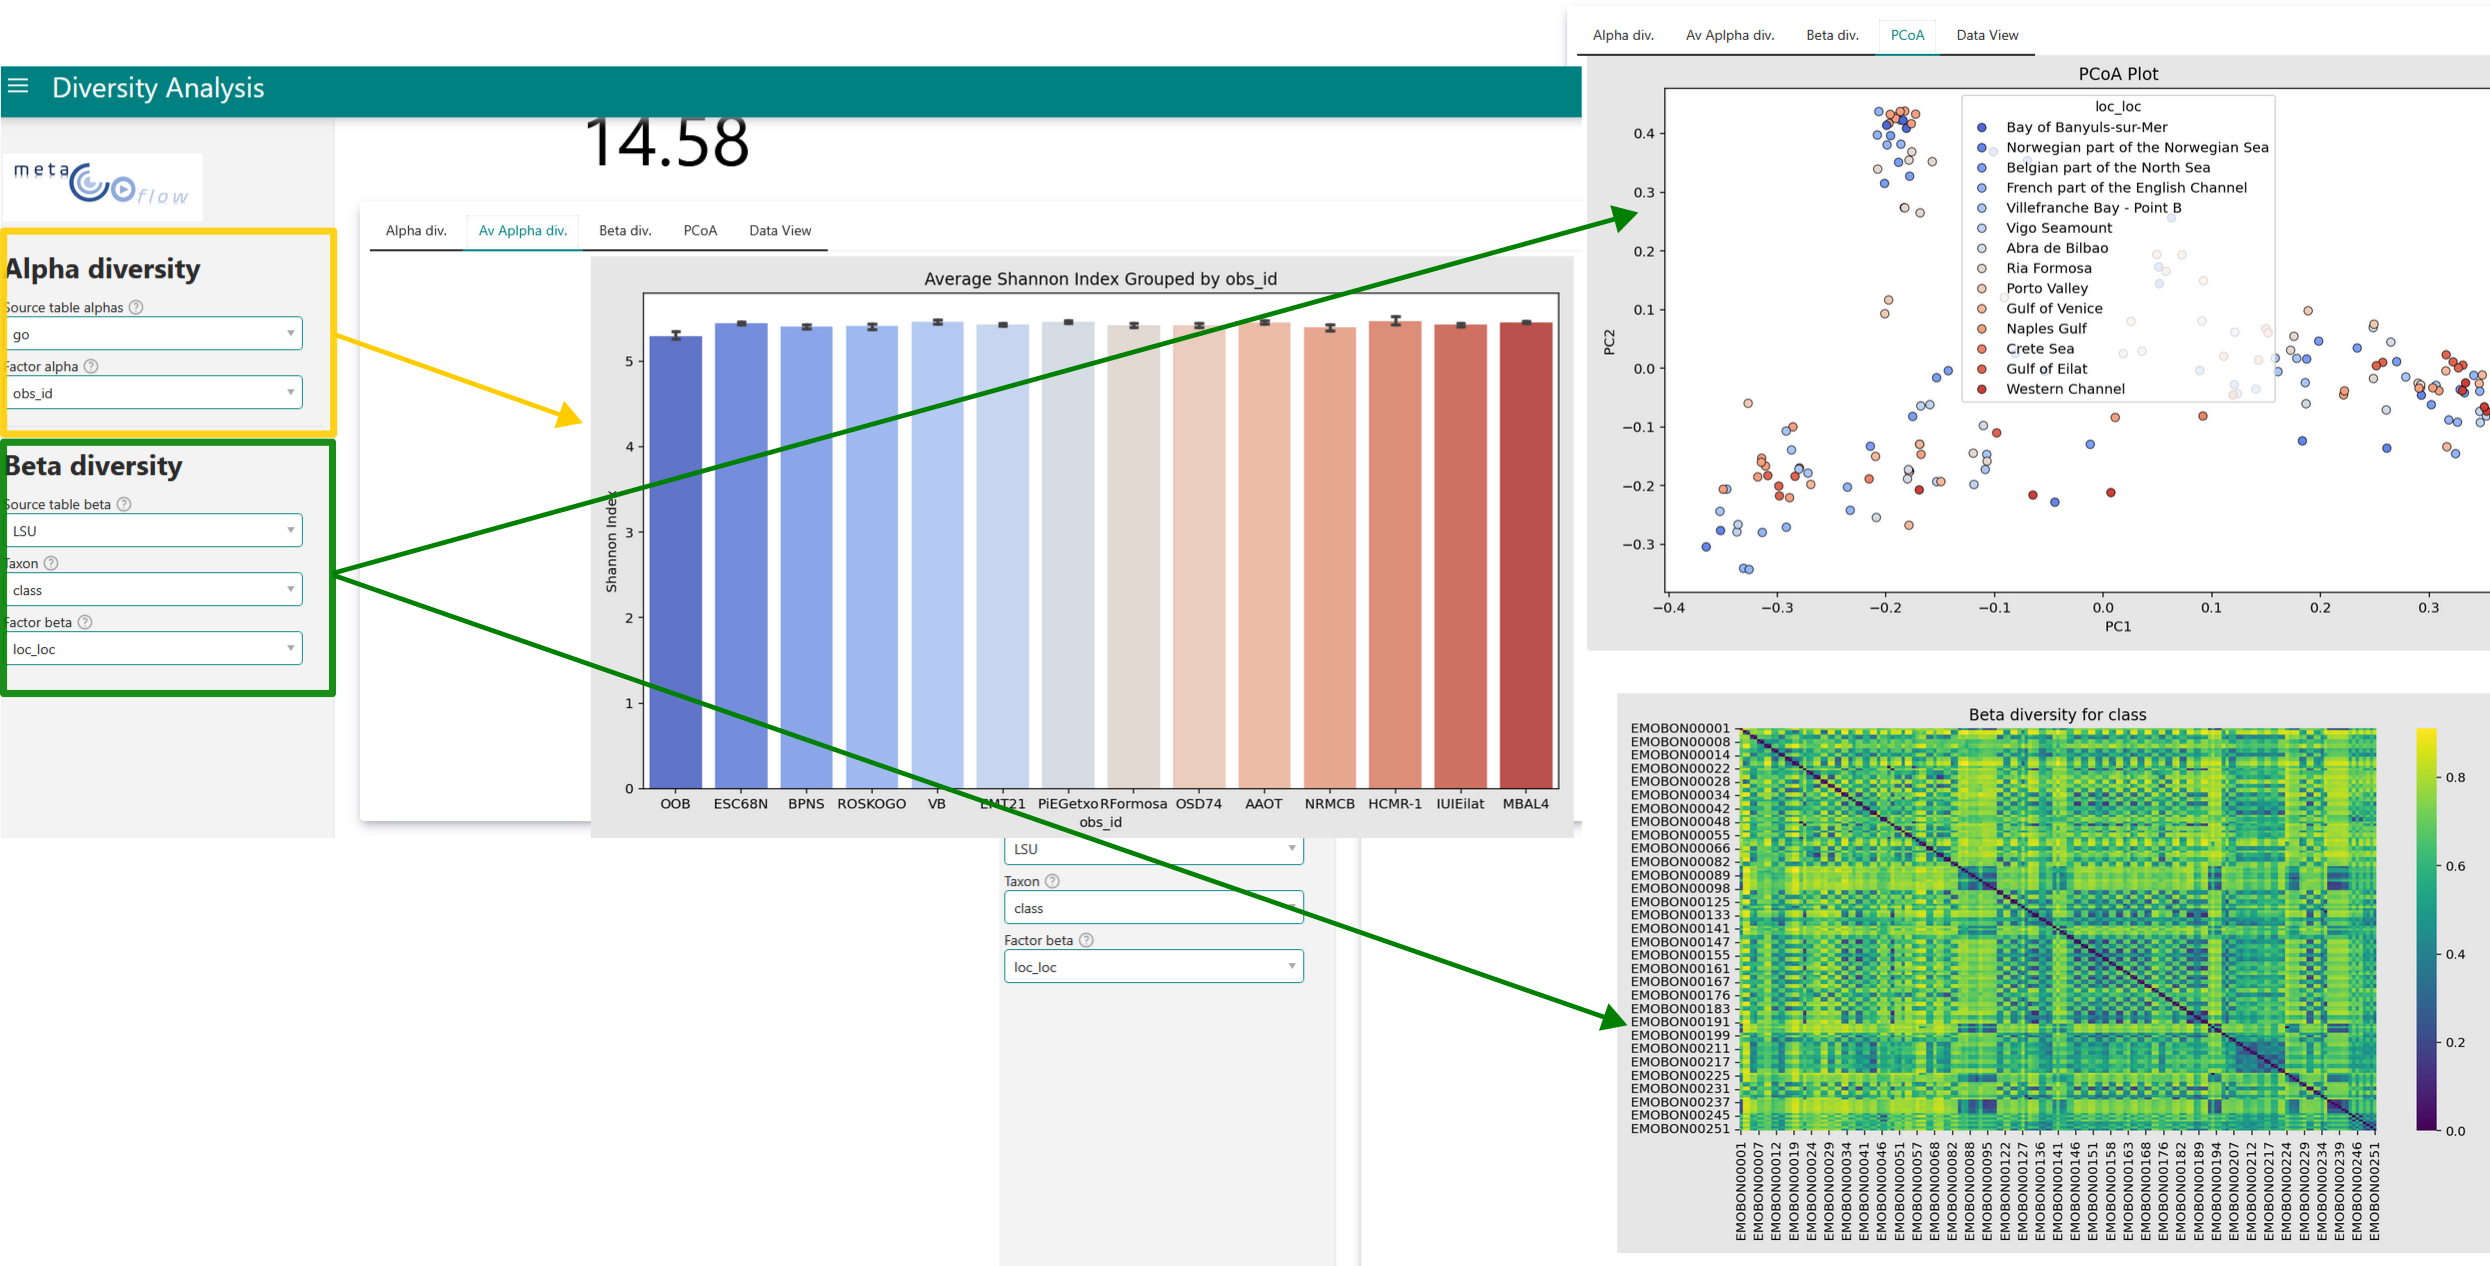
Alpha and Beta diversity dashboard
Provides visualization of alpha and beta diversities of the metaGOflow analyses.
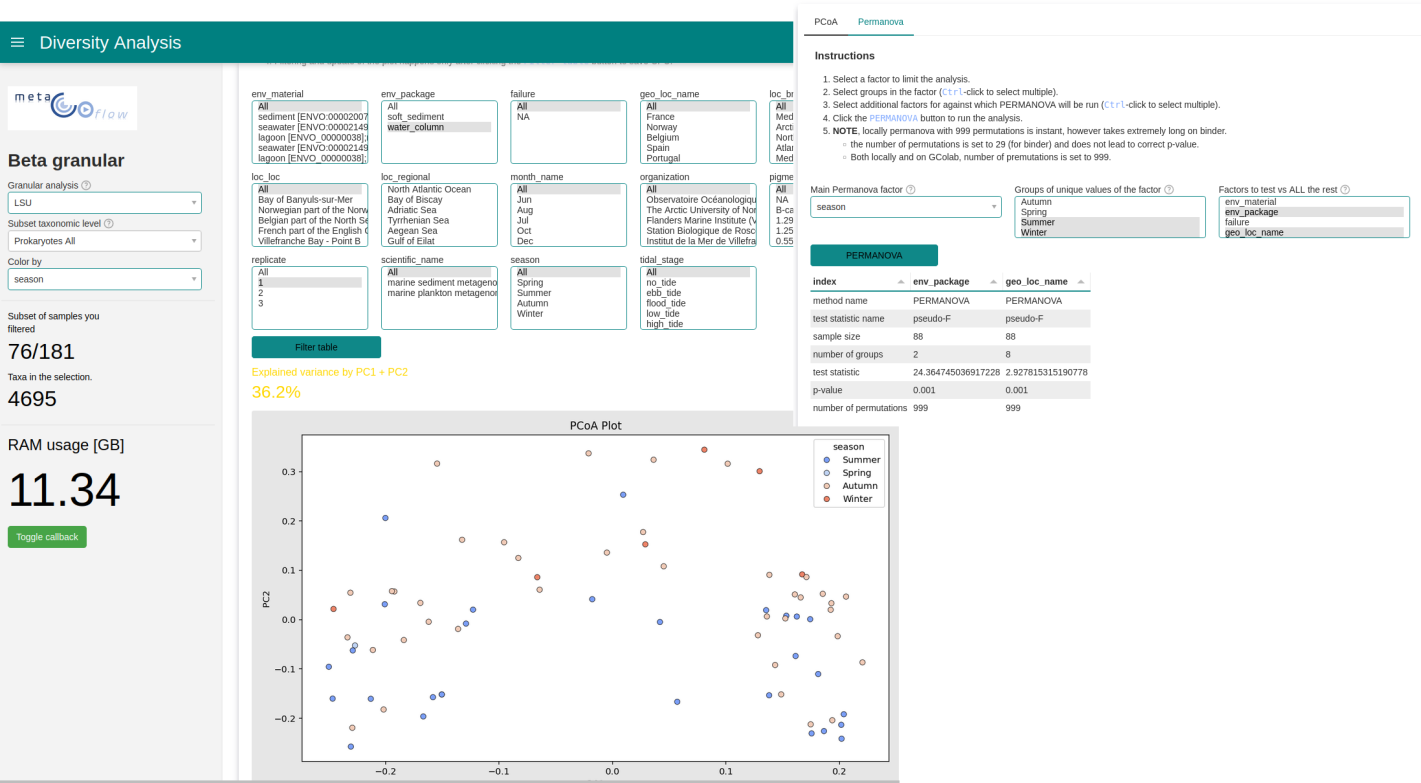
Granular Beta diversity dashboard
This dashboard allows to pivot the tasonomy LSU and SSU tables, therefore is computationally more demanding.
Tables pivot species according to certain pre-selected taxa. Select, filter and visualize PCoA of the taxonomy in respect to categorical variables. In addition, you can calculate permanova on those subsampled taxonomy selections.
Notes
Please raise issues and add/request features on the repository Github.