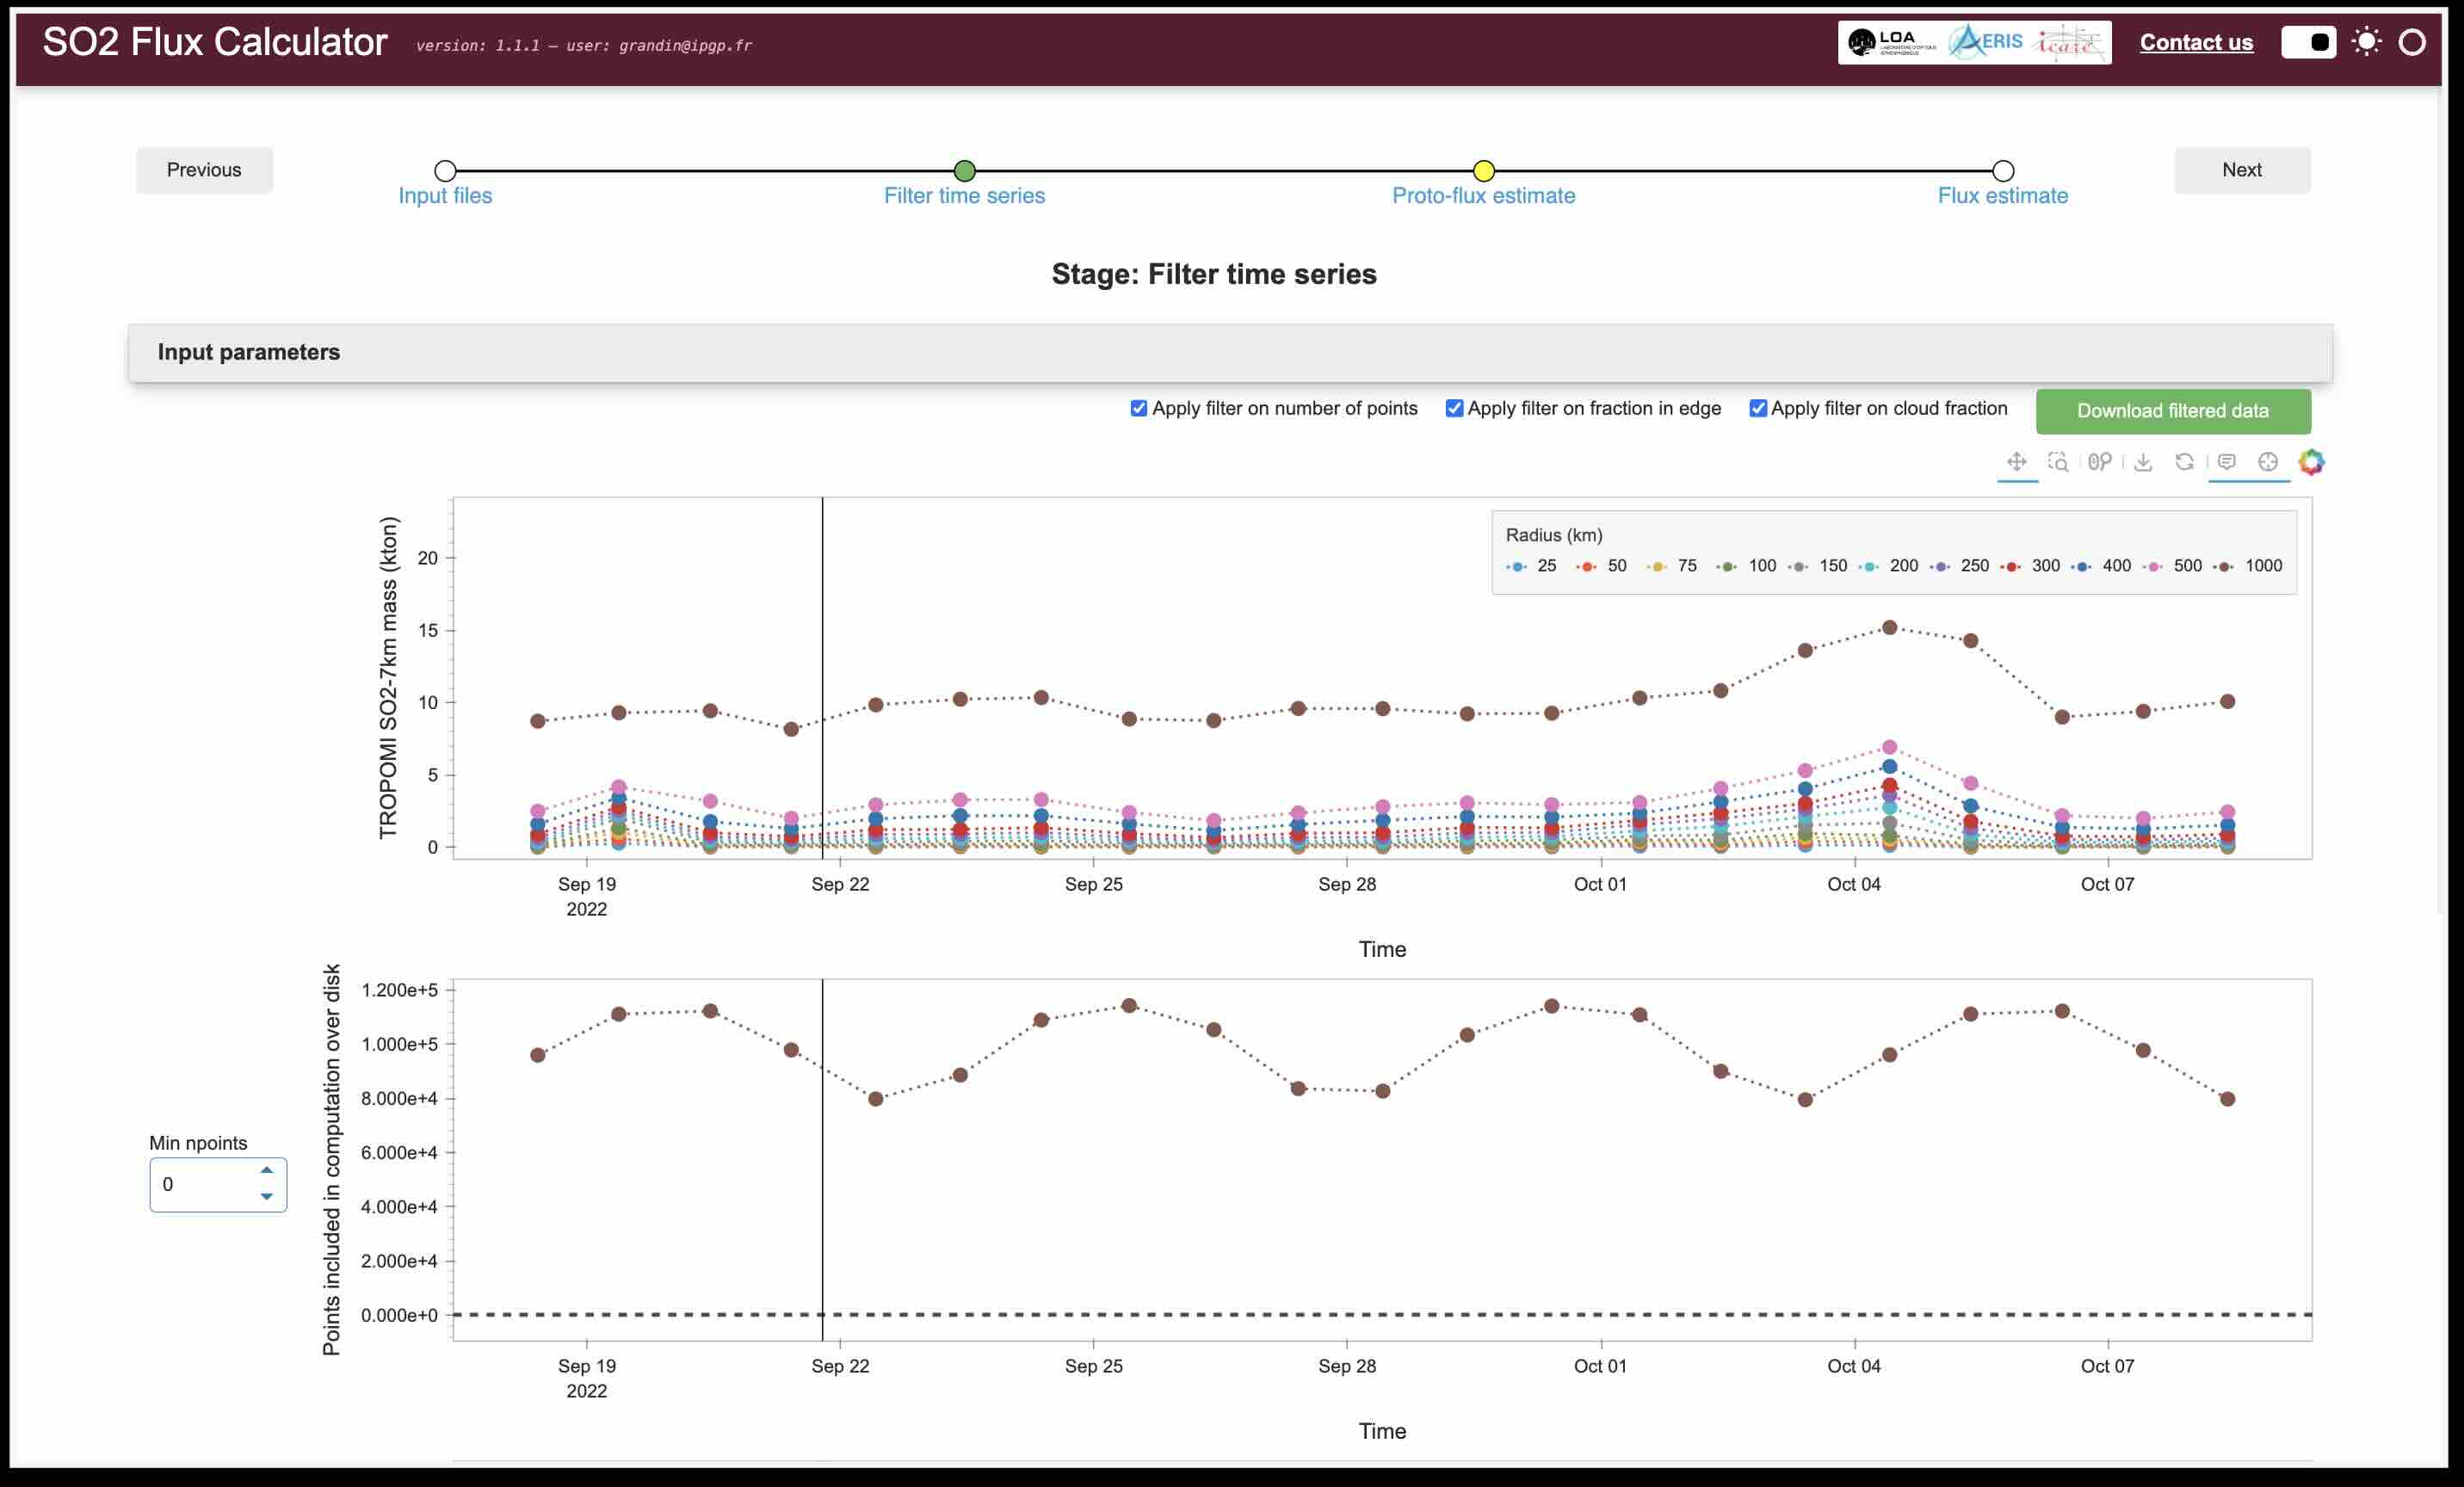
The SO2 mass time-series are displayed to let you check visually that everything looks right.
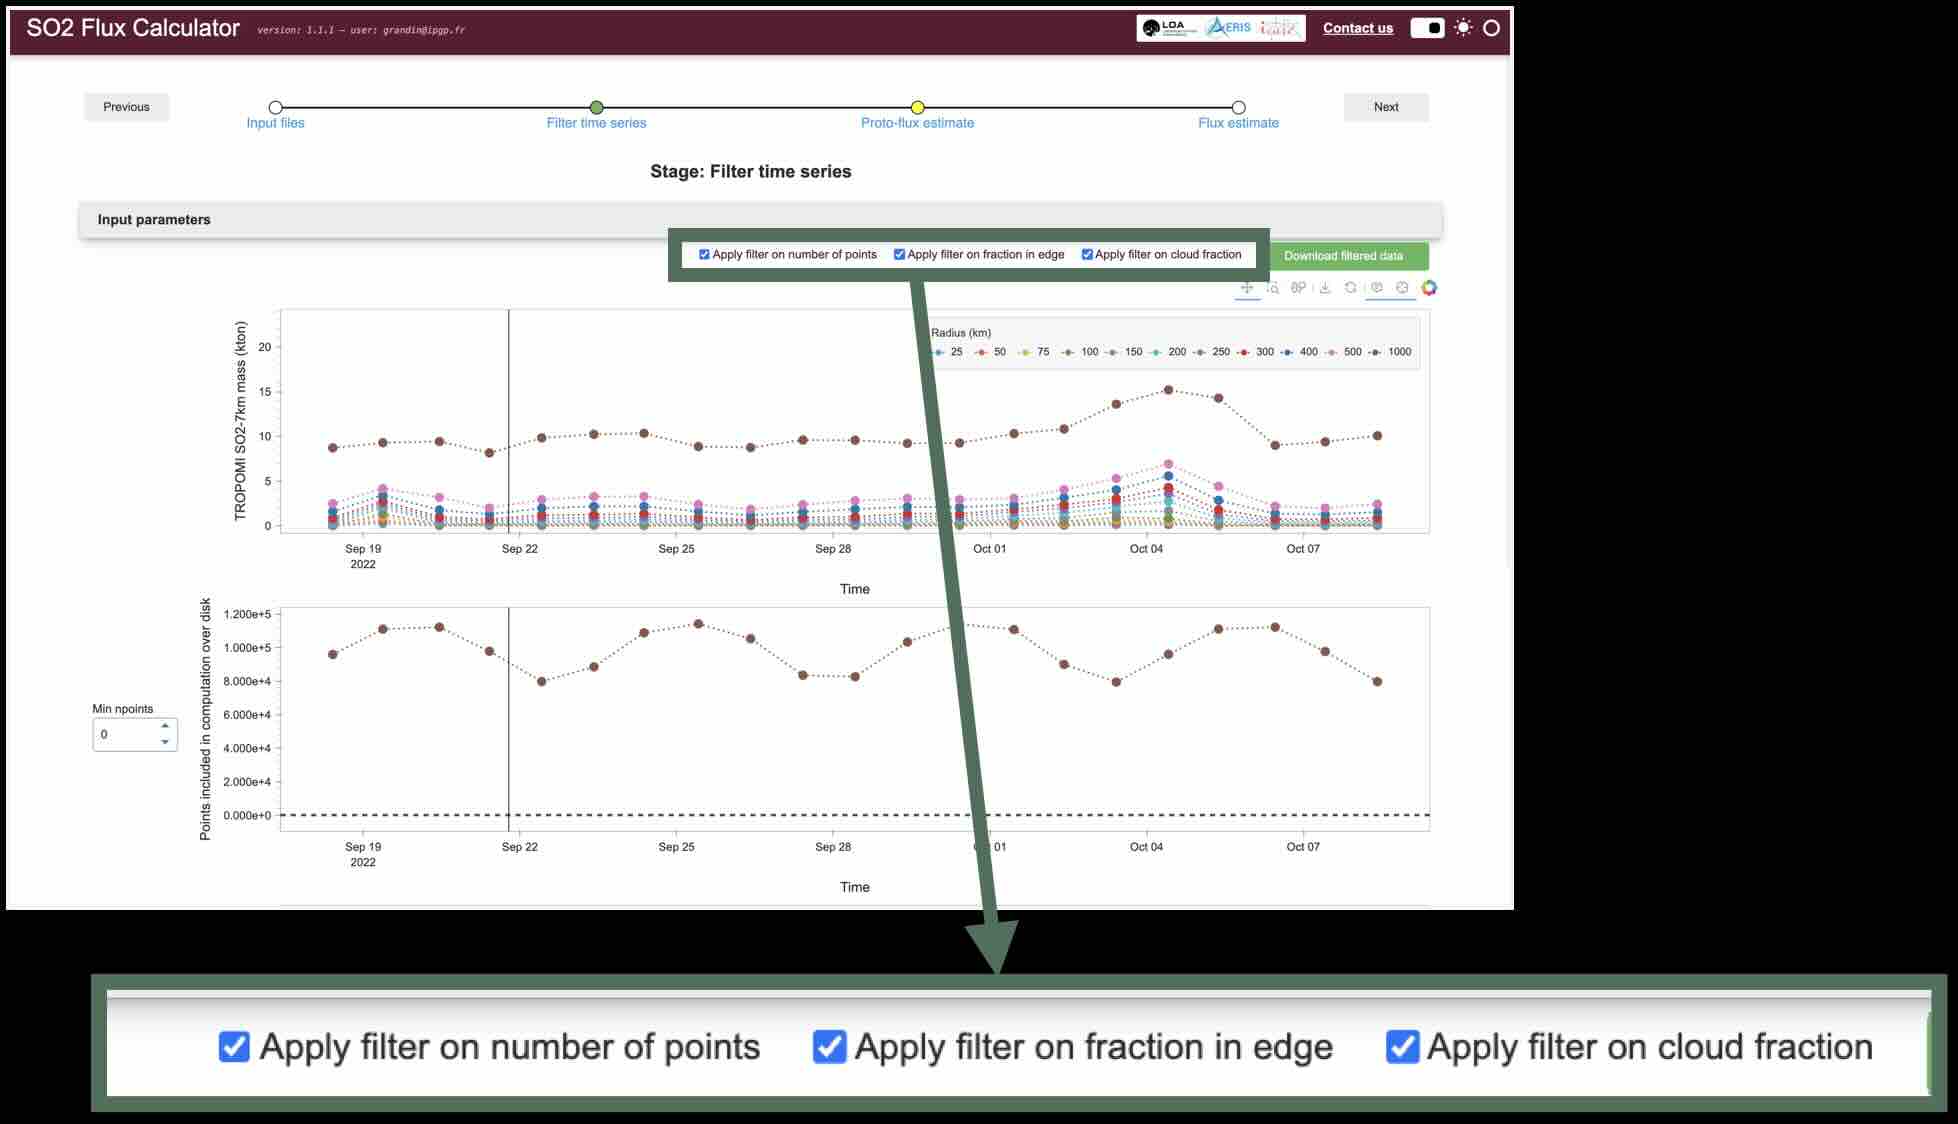
Optionally, you may choose to apply some quality filters to your input data, in order to remove “bad” data points.
Filter parameters include:
number of points: minimum number of points within the disk. A small number of points generally means that the image only partially covers the disk;fraction in edge: maximum percentage of points that are flagged as “swath edge pixels” within the disk interior. A high percentage means that many points from the swath edge fall within the disk, hence producing a noisy result;cloud fraction: maximum cloud fraction (0: no clouds; 1: 100% of clouds) within the disk. A large cloud fraction generally means that the data is affected by clouds, which decreases the confidence on the estimated SO2 mass burden.
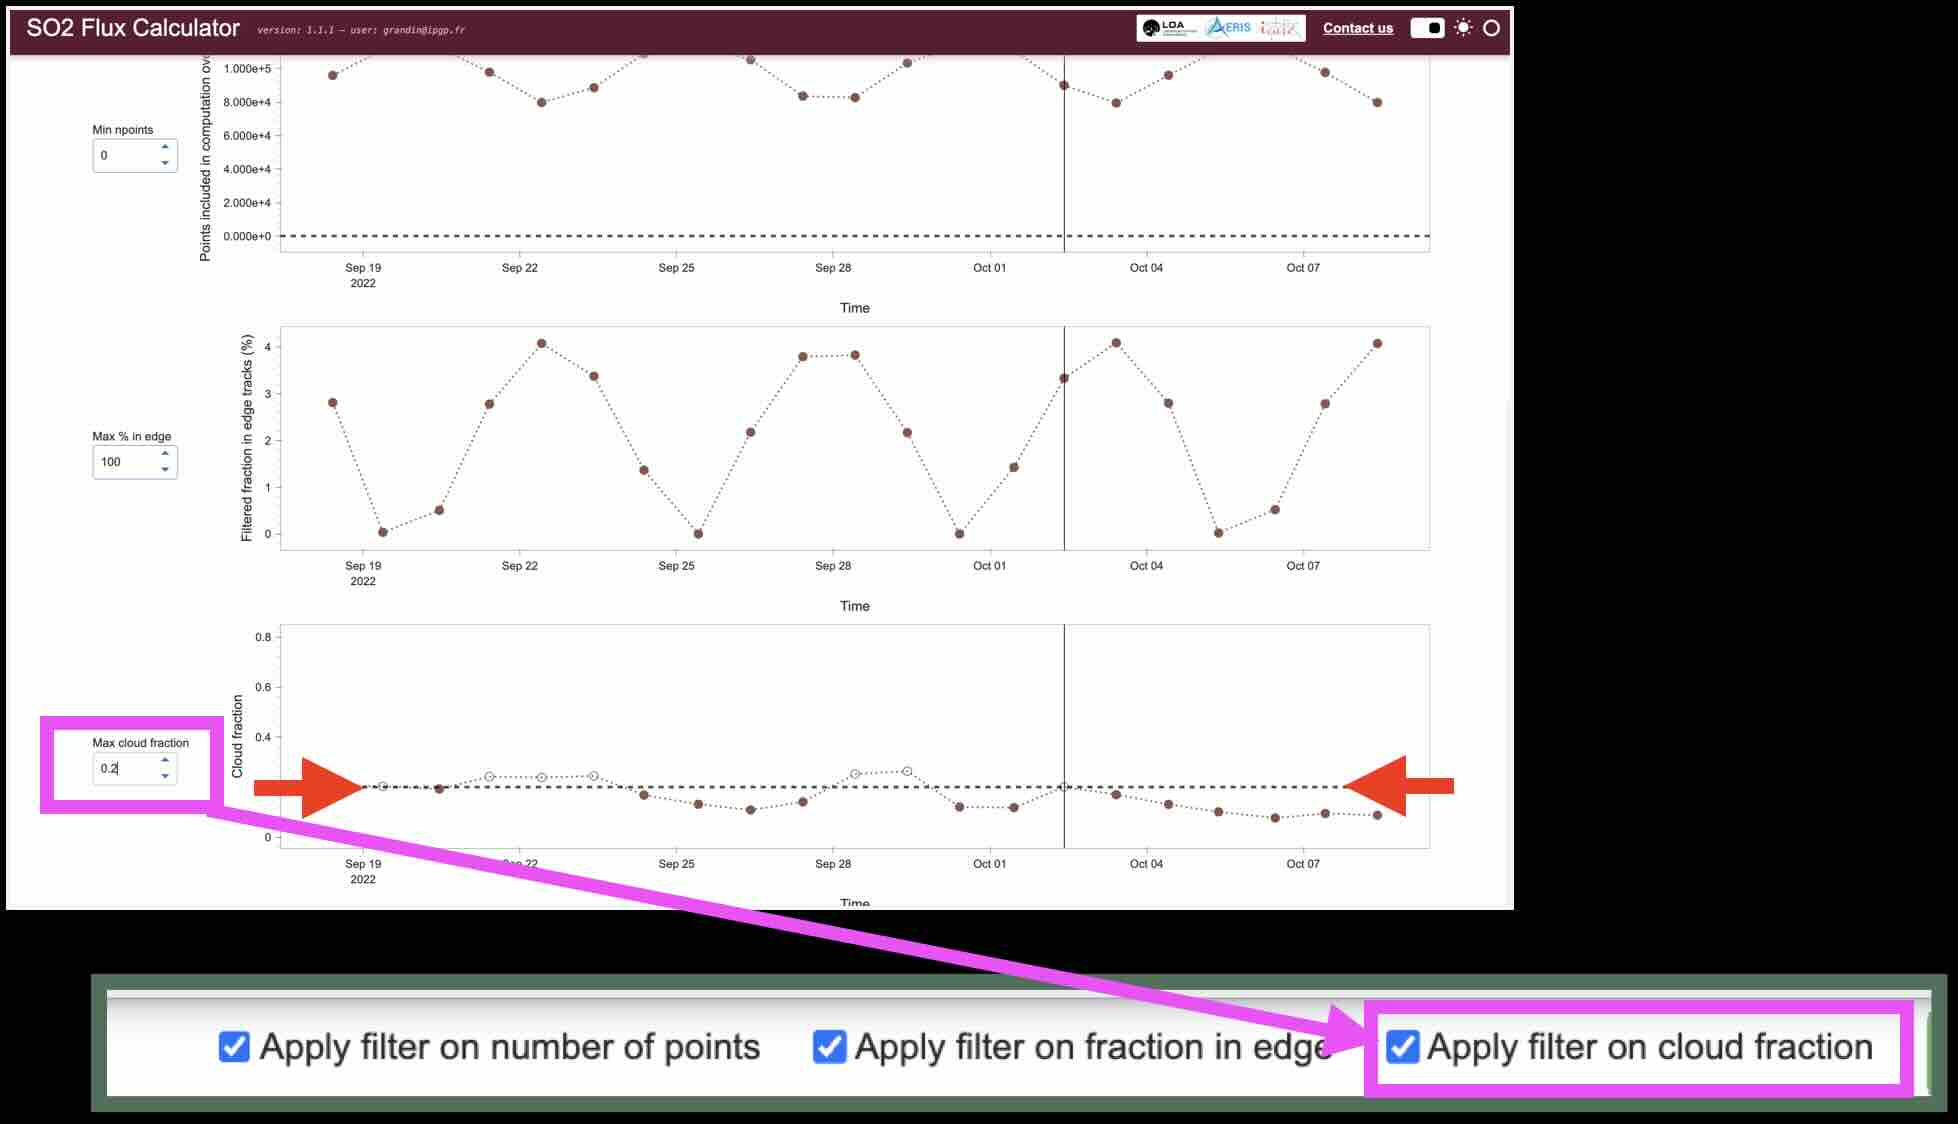
By defaults, these quality criteria apply to the disk with the largest radius in the input dataset.
For example, if you check the Apply filter on cloud fraction box, you will be able to adjust the maximum cloud fraction that defines the threshold between “bad” and “good” data (shown by the dashed horizontal line).
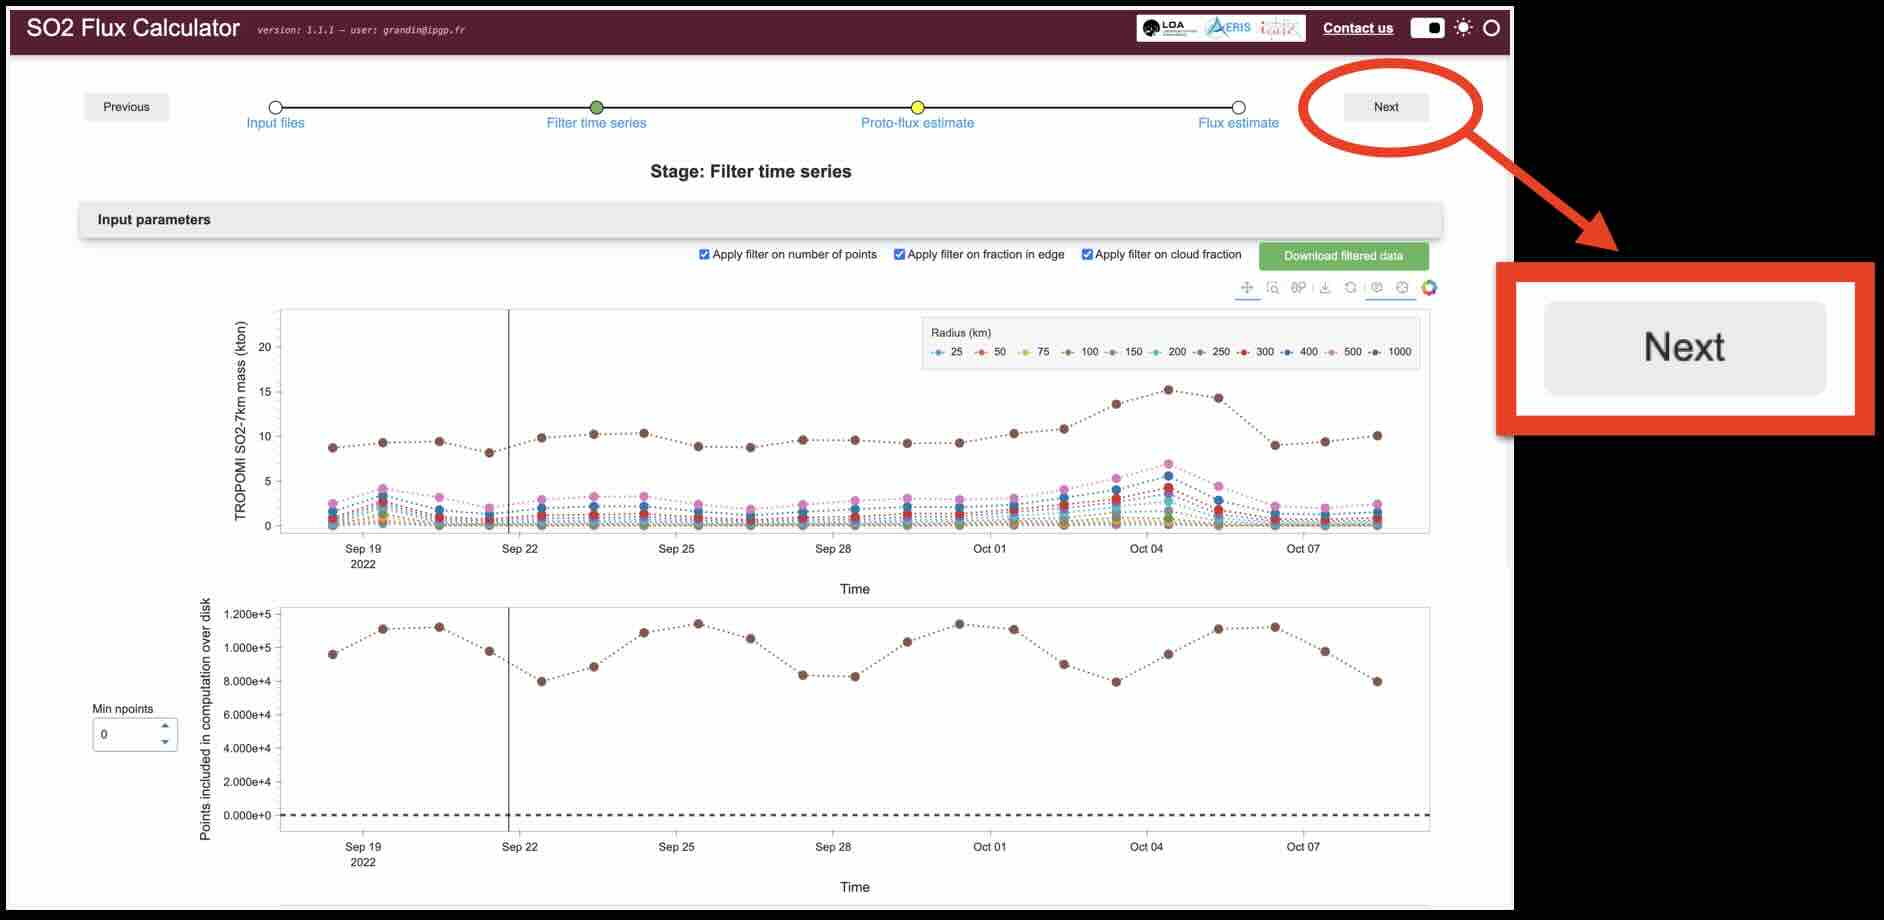
When you are ready to process these filtered data, click on Next. This will bring you to Step 3.